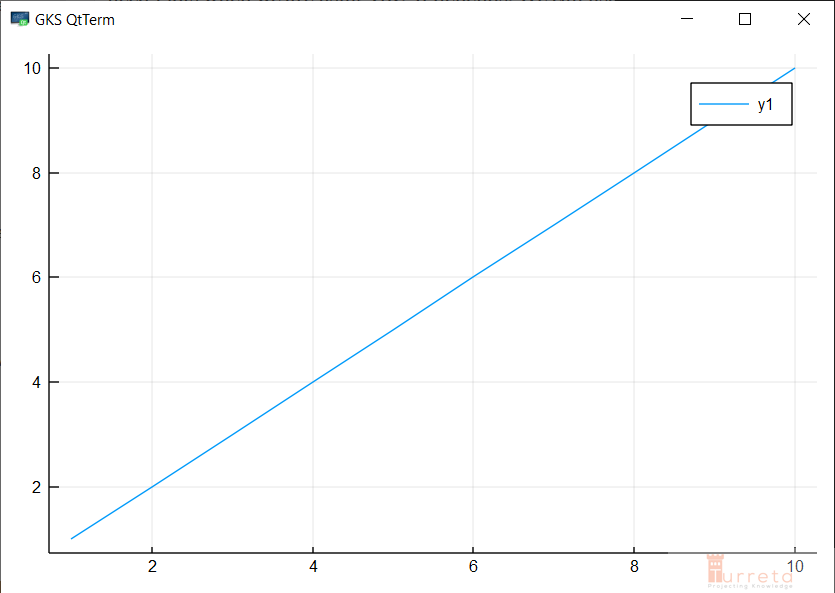
Plotting numbers in the XY graph in Julia can help us create the big picture. This post shows how to plot data points in a graph using the Plots and GR packages. These data points are our x-y coordinates.
Install Plots And GR Packages In Julia
Before we install these packages, we need to install Julia on our machine. Once installed and configured, start up the Julia interpreter. We can either use the Pkg.add() command in the current shell mode or enter package mode to install packages. When we are in the current shell mode, we use the following commands in Julia. The Plots package does not need to come first.
1 2 3 4 | julia>Pkg.add("Plots") ... julia>Pkg.add("GR") ... |
Alternatively, we run similar commands in the package mode to install the Plots and GR packages. Note that we need to go back to the shell mode to plot points in the graphs. To enter the package mode, type ] after the julia> prompt.
1 2 3 4 | julia>] ... (@v1.4) pkg> ... |
The package mode prompt replaces the shell mode prompt. Then, we use the commands – add Plots and add GR, as follows.
1 2 3 4 5 6 7 8 9 10 11 12 13 14 15 16 17 18 | (@v1.4) pkg> add Plots Updating registry at `C:\Users\karldev\.julia\registries\General` Updating git-repo `https://github.com/JuliaRegistries/General.git` Resolving package versions... Installed OpenSSL_jll ──── v1.1.1+2 Installed x264_jll ─────── v2019.5.25+1 ... [dfaa095f] + x265_jll v3.0.0+0 Building GR ───→ `C:\Users\karldev\.julia\packages\GR\yMV3y\deps\build.log` Building Plots → `C:\Users\karldev\.julia\packages\Plots\cc8wh\deps\build.log` ... (@v1.4) pkg> add GR Resolving package versions... Updating `C:\Users\karldev\.julia\environments\v1.4\Project.toml` [28b8d3ca] + GR v0.48.0 Updating `C:\Users\karldev\.julia\environments\v1.4\Manifest.toml` [no changes] |
The Plots package is a visualization interface and toolset where users interact directly by issuing commands together with data points. It wraps the GR package, which is a framework for visualization. The GR package has different types of graphs that we can use. Do we need Plots when we are using GR? It depends. We can use GR without Plots. However, visualization is complicated, but the Plots package makes it easier for Julia to plot X Y on graphs.
Plot XY Data Points In Graph
We can now plot some XY data points in a graph and display it. On the Julia command prompt, run the following commands.
1 2 3 4 5 6 7 8 9 10 11 12 | julia> using Plots julia> gr() Plots.GRBackend() julia> x=1:10 1:10 julia> y=1:10 1:10 julia> plot(x,y) |
Our data points are limited, and we have the same values for both the x-y coordinates. The plot command will display the graph in a separate window, as shown below. It may take a few seconds to display the X Y graph.

After learning how to plot XY data points in graphs in Julia using Plots and GR, we can now explore other graphs with more complex data.
![]()


